I’m currently looking more into security aspects of distributed systems, with most efforts going into privacy preservation when monitoring crowds.
Monitoring crowds
For several years, I have been concentrating on monitoring the mobility of people, assuming they carry a device such as an electronic badge or a smartphone.
Our current research mainly concentrates on increasing the accuracy of detections (and thus the data analyses) and preserving privacy, which form part of our Living Smart Campus project at the UT. Much of this work is done in collaboration with the Polytechnical University of Bucharest.
When detections are accurate: what we do (protecting privacy)
We developed a model for protecting detections of devices while still being able to count how many devices moved between two different locations (see below). Our current research concentrates on situations in which we can reliably detect a device. This happens, for example, when travelers check in or out using public transportation. The whole idea is that we encrypt detections at the sensors, after which a server works on the encrypted data to answer questions about how many people moved between (several) locations. We can provide hard guarantees that no individual can be traced back from the data on which we operate. Our main research question is how accurate we can do statistical counting given a myriad of urban-related questions, while protecting the privacy of the people whose movements we are counting.
WiFi scanning: what we did (protecting privacy)
An important component of our work is to monitor crowd flows while preserving privacy by design. This has turned out to be a nasty problem that has not been addressed enough. Counting the number of devices at a single location while protecting them from being identified is relatively simple. The difficulty is counting the number of devices that move from location A to location B in a privacy-preserving manner.
Our current solution is to have sensors save detections in encrypted Bloom filters. Bloom filters are bit strings used to represent sets and essentially support only membership testing, basic set operations (intersection, union) and estimating the size of a set. These properties allow us to compute the Bloom filter representing the intersection of what we detected at A and what was later detected at B. We can then compute the size of that set, which is the number of devices that had moved from A to B.
Proper encryption and shuffling the bits prevents that neither the sensors nor even the entity capable of decrypting a Bloom filter to discover detections. Only statistical counts can be retrieved from this setup.
WiFi scanning: what we did (understanding measurements)
Much of the current efforts are targeted toward more practical crowd monitoring, namely through scanning of WiFi-enabled personal devices such as smartphones. There are important differences with using badges. First, because so many people carry a smartphone, large-scale experiments with thousands of devices become possible. We have monitored multi-day festivals with over 100,000 participants. Second, WiFi data is extremely noisy, meaning that there is a tremendous data-analytics problem before we can even draw conclusions. Third, because smartphones do not detect each other, we have essentially lost a very powerful instrument: our proximity graphs. Fourth, because we are unintrusively monitoring personal devices, there are serious privacy issues to deal with.
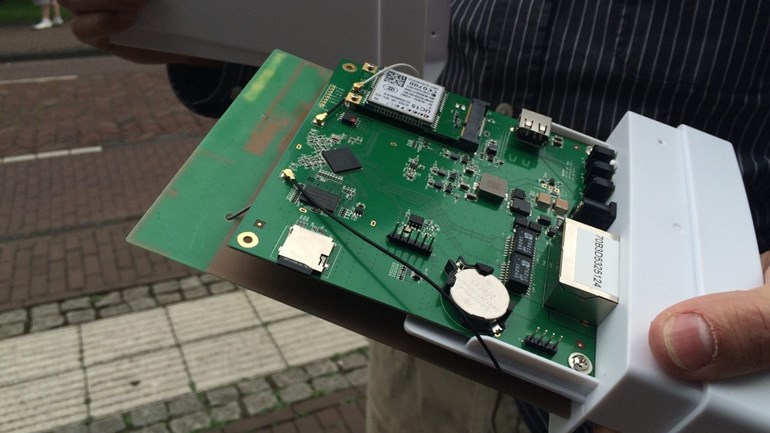
We have run experiments with indoor and outdoor (see picture) sensors, previously provided by BlueMark Innovations.

Back in the old days: using active badges
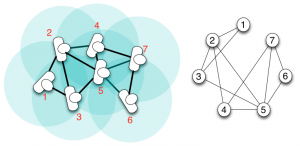
Our first efforts toward crowd monitoring used active badges. Participants were required to use a home-brewed device that deployed a wireless so-called gossiping protocol to exchange information. The main challenge was to devise a large-scale wireless system in which the badges operated on a very low duty cycle (less than 1%, meaning they were passively asleep 99% of the time), while waking up all at the same time. During the active period they would be able to detect each other, which was the information we used to extract a proximity graph. This is a spatial-temporal graph reflecting which devices had detected each other (see the example). We managed to build real systems with over 400 badges and ran simulations demonstrating we could handle thousands of devices that stayed synchronized even in the presence of network partitions.
 |
 |